Metrics API
The Metrics API can be used to query common metrics of a device or system metrics related to your customer. The metrics are stored in a time series database and can be queried with aggregation functions, labels and time ranges.
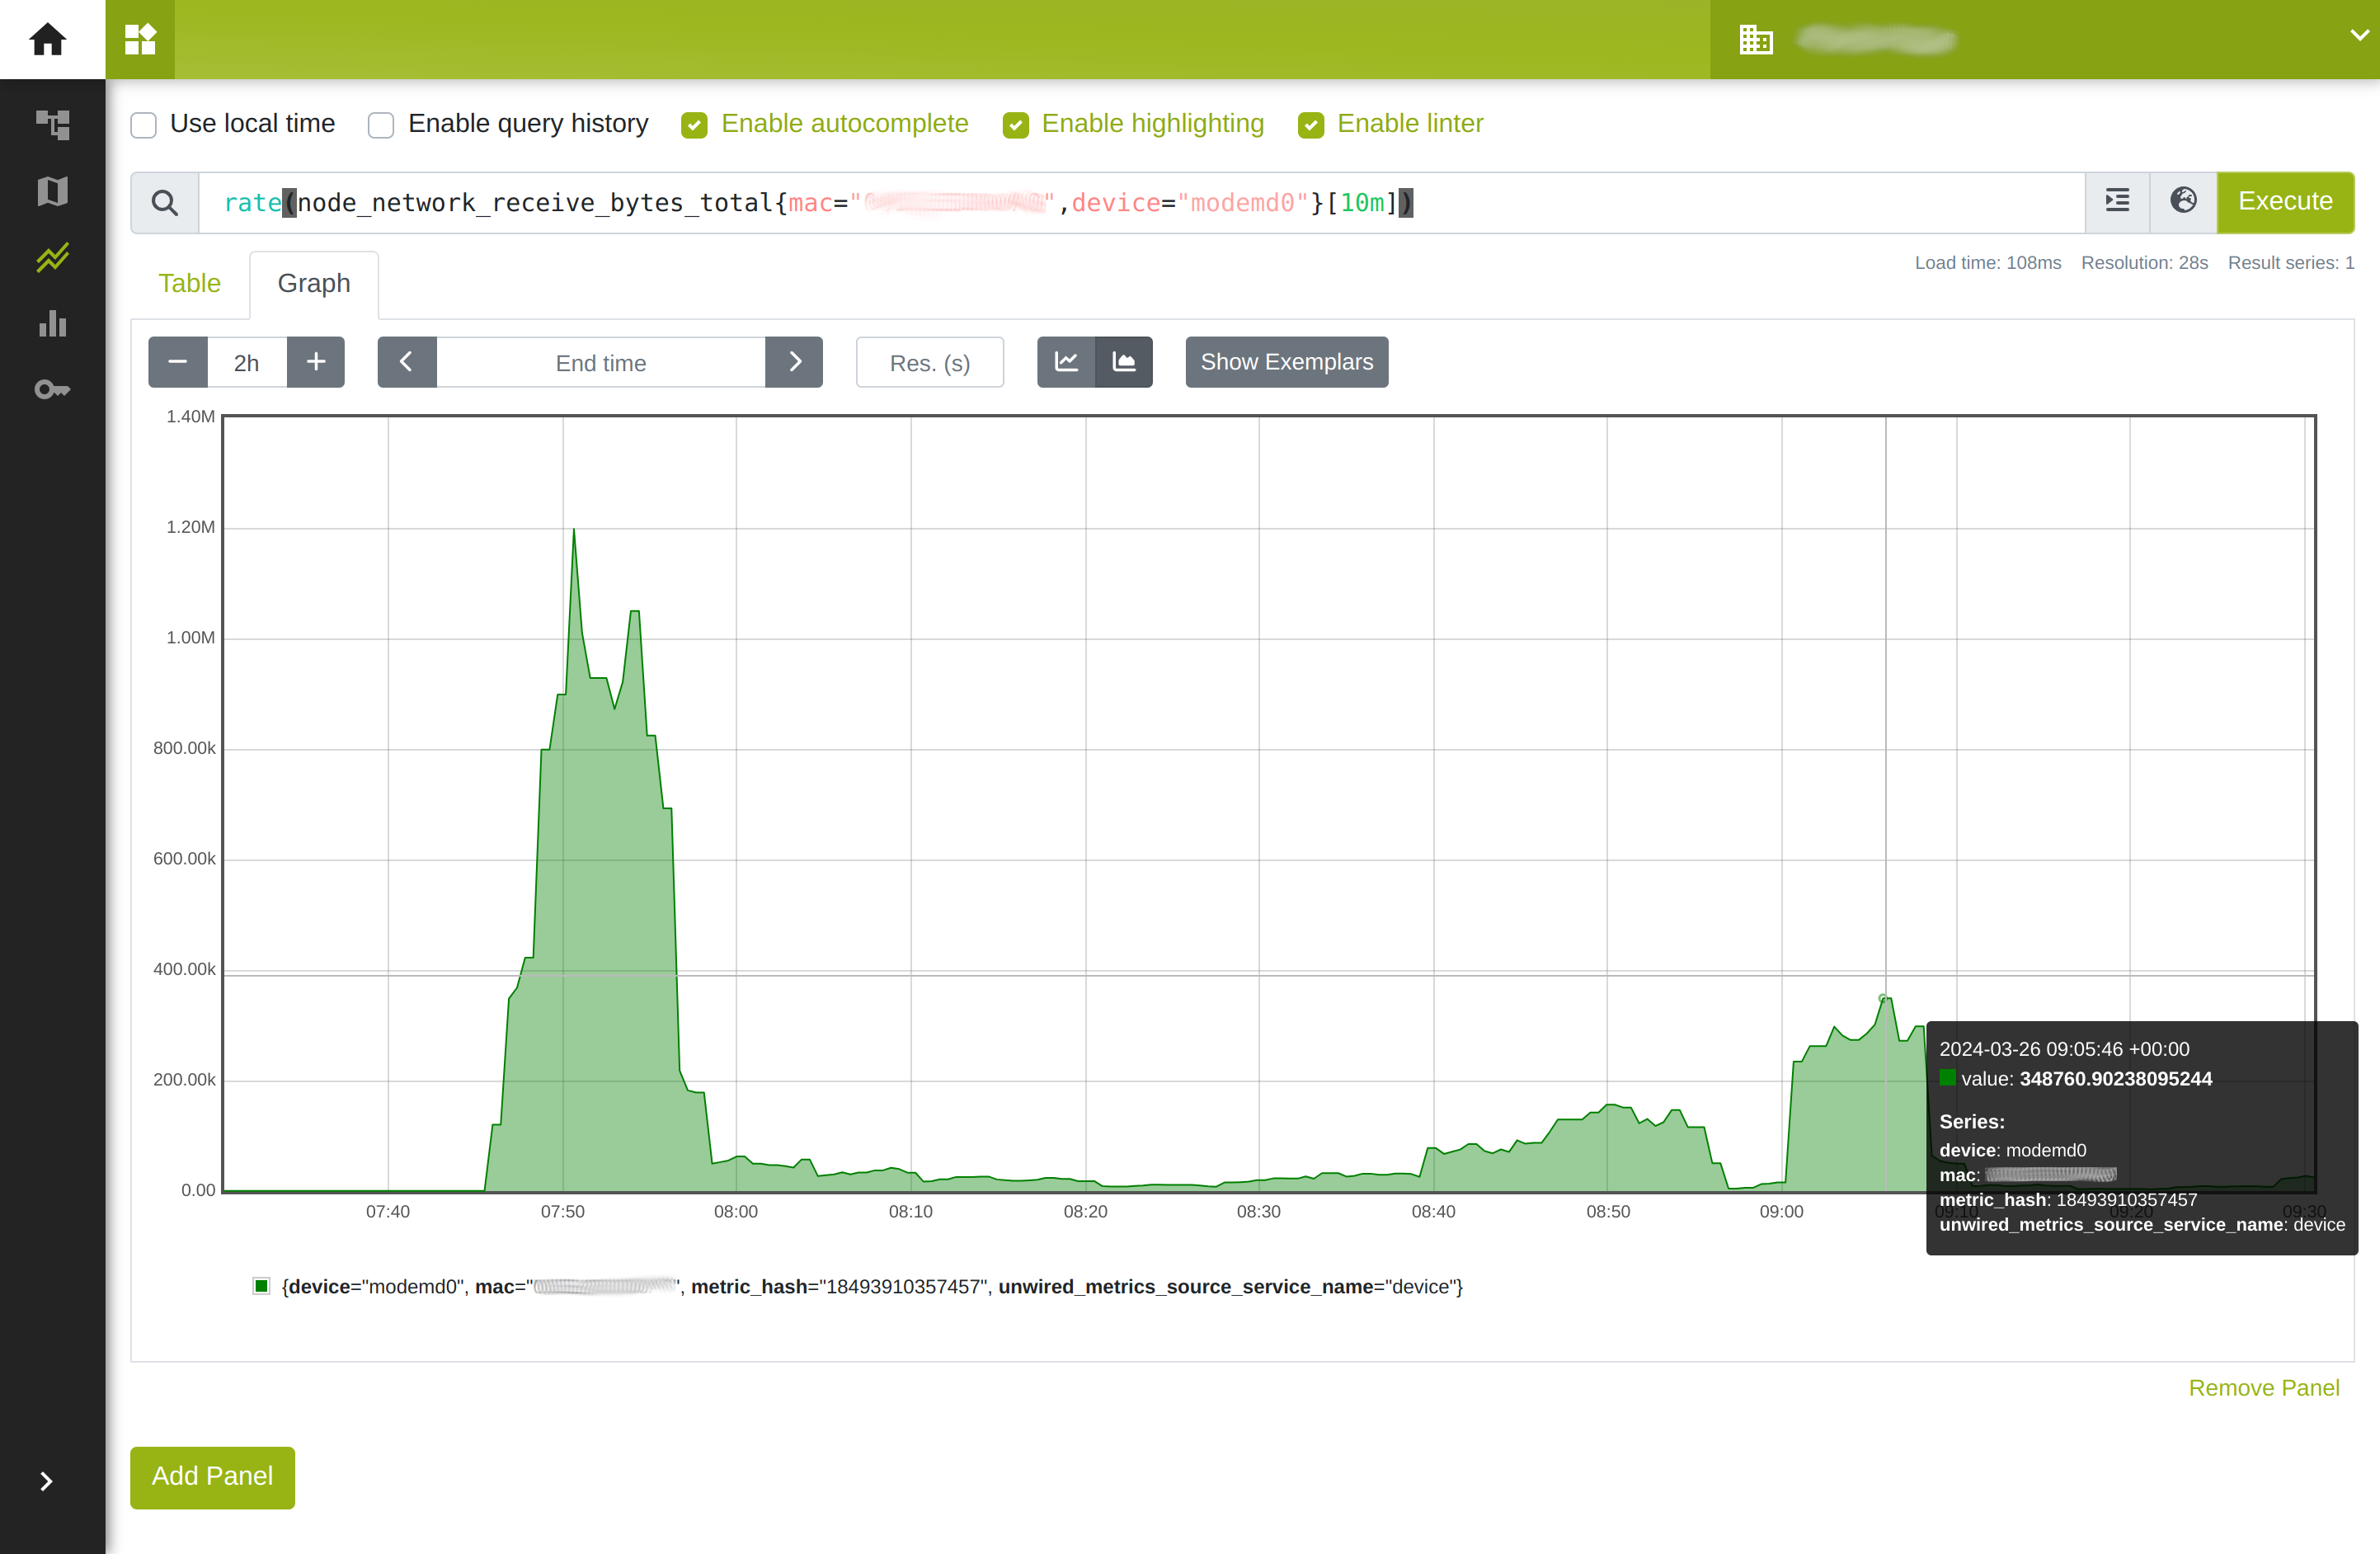
We are mirroring the Prometheus API to provide a simple and easy to use API for querying metrics.
Hint
The UI is available at Unwired Edge Cloud Console.
Note
This API is limited to our data retention policy, which is currently 14 days.
API Endpoint
The API is available at https://admin.wifi.unwired.at/api/metrics/customer/<customer_id>/ and can be accessed with a valid API Key (HTTP Header authorization: apikey <apikey>) or by being logged in to the Unwired Edge Cloud Console.
Note that the API access is scoped to the Customer ID passed in the URL. You can only access metrics of devices that belong to the Customer ID you are querying. You can find your Customer ID in the URL when opening the Unwired Edge Cloud Console or querying it via the GraphQL API.
We provide following endpoints to query metrics equivalent to the Prometheus API. Please refer to the attached links for more information on how to use each endpoint and which parameters are available.
Query metrics (Instant queries):
/api/metrics/customer/<customer_id>/api/v1/query
Query metrics over a range (Range queries)
/api/metrics/customer/<customer_id>/api/v1/query_range
Get values for a label (Querying label values)
/api/metrics/customer/<customer_id>/api/v1/label/<label_name>/values
Get series for a label (Finding series by label matchers)
/api/metrics/customer/<customer_id>/api/v1/series
Get all labels (Getting label names)
/api/metrics/customer/<customer_id>/api/v1/labels
Get metrics from multiple sources (Federation)
/api/metrics/customer/<customer_id>/federate
Note
Our data can be considered updated in a 2 minute interval. So we expect you to not query data more frequently than every 2 minutes.
Scraping metrics
We provide the /federate endpoint to scrape metrics from your accesible devices. The endpoint is available at https://admin.wifi.unwired.at/api/metrics/customer/<customer_id>/federate and the query language is the same as in Prometheus.
This endpoint is thought to be used by your monitoring system to scrape metrics from your devices and store them in your system for further processing.
You have to pass at least one match[] parameter to filter the metrics you want to scrape. The match[] parameter is a label matcher and can be used to filter the metrics you want to scrape. You can pass multiple match[] parameters to filter for multiple labels.
If you are logged in to the Unwired Edge Cloud Console, your credentials will be used to authenticate against the endpoint. You can use an API Key to authenticate against the endpoint as well.
Known limitations
Caution
Some endpoints regarding auto complete may not return the complete datasets because of internal limitations. Metrics containing a mac label will not be affected by this limitation - which is the case for every device metric and most other metrics.
Note
We do not provide the Alert API to create alerting rules and silencing rules. You have to implement this in your monitoring system.
Note
You may wonder about specific labels which are added to the metrics. These labels are added by the Unwired Edge Cloud Console and are used for internal purposes. You can ignore them.
If there are any labels missing in metrics coming from your containers, we may unintentionally filter them out. Please let us know if this is the case.
API examples
Scraping all metrics of one specific device:
GET /api/metrics/customer/<customer_id>/federate?match[]={mac="<mac>"}
Scraping a specific metric of one device:
GET /api/metrics/customer/<customer_id>/federate?match[]=node_cpu_seconds_total{mac="<mac>"}
Example Response from federation endpoint:
node_cpu_seconds_total{cpu="cpu0",mac="4200AABBCCDD",metric_hash="18493910357457",mode="system",unwired_metrics_source_service_name="device",instance=""} 3889.08 1711451432827
node_cpu_seconds_total{cpu="cpu0",mac="4200AABBCCDD",metric_hash="18493910357457",mode="user",unwired_metrics_source_service_name="device",instance=""} 3547.26 1711451432827
Querying the cpu load of a device over time:
GET /api/metrics/customer/<customer_id>/api/v1/query_range?query=sum+%28rate%28node_cpu_seconds_total%7Bmac%3D%224200AABBCCDD%22%7D%5B5m%5D%29%29+by+%28cpu%29&start=1711447505.252&end=1711451105.252&step=14
For more examples and detailed information on how to use the API, please refer to the Prometheus API documentation. Or explore possible metrics, queries and labels in the Unwired Edge Cloud Console.
Custom node labels
Add custom node labels to your devices through the Unwired Edge Cloud Console to organize and aggregate metrics in your monitoring system.
For example, if your monitoring setup uses vehicle_id instead of the MAC address as the main identifier, you can add vehicle_id as a device label.
Then match devices by vehicle_id, join with other metrics on (mac), and run PromQL aggregations (for example, grouped by vehicle_id).
node_status and on (mac) node_label{key="vehicle_id", value="TrainA"}